
Class 11PhysicsOscillationsDifferent types of oscillations (Free, Damped, Forced Oscillation and Resonance)
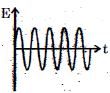
EasyWhich of the diagrams shown in the figure represents the variation of the total mechanical energy of a pendulum oscillating in water as a function of time?
- A
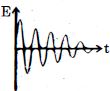
- B
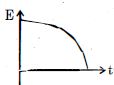
- C
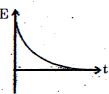
- D
Explore More
Similar Questions
$A$ particle is performing simple harmonic motion. If the oscillations are damped oscillations,then the angular frequency is given by:
The value of maximum possible amplitude in the case of forced oscillations when the driving frequency is close to the natural frequency is:
Easy
View Solution$A$ block of mass $0.1\, kg$ is connected to an elastic spring of spring constant $640\, Nm^{-1}$ and oscillates in a damping medium of damping constant $10^{-2}\, kg\,s^{-1}$. The system dissipates its energy gradually. The time taken for its mechanical energy of vibration to drop to half of its initial value is closest to ..... $s$.
DifficultJEE MAIN 2017
View SolutionIn case of a forced vibration,the resonance wave becomes very sharp when the:
$Assertion :$ Resonance is a special case of forced vibration in which the natural frequency of vibration of the body is the same as the impressed frequency of external periodic force and the amplitude of forced vibration is maximum.
$Reason :$ The amplitude of forced vibrations of a body increases with an increase in the frequency of the externally impressed periodic force.
$Reason :$ The amplitude of forced vibrations of a body increases with an increase in the frequency of the externally impressed periodic force.
MediumAIIMS 2010
View SolutionVedclass Products
For Students
Vedclass Test Series
Mock tests in real JEE/NEET style with performance analysis. 5-day free trial.
Start Free TrialFor Teachers
Exam Paper Generator
Generate Set A/B/C/D exam papers from 7.5L+ questions in 2 minutes. 3 chapters free.
Try FreeFor Institutes
Online Exam Module
Live online exams with unlimited students, 360° analytics & white-label branding.
See Demo